Independence Calculator

Information about the Independence Calculator
With the independence calculator you can estimate the self-consumption rate and degree of self-sufficiency for a typical photovoltaic system with battery storage on a single family house in Germany. Real values can differ up to more than 10% from the calculated results depending on the location and consumption behaviour.
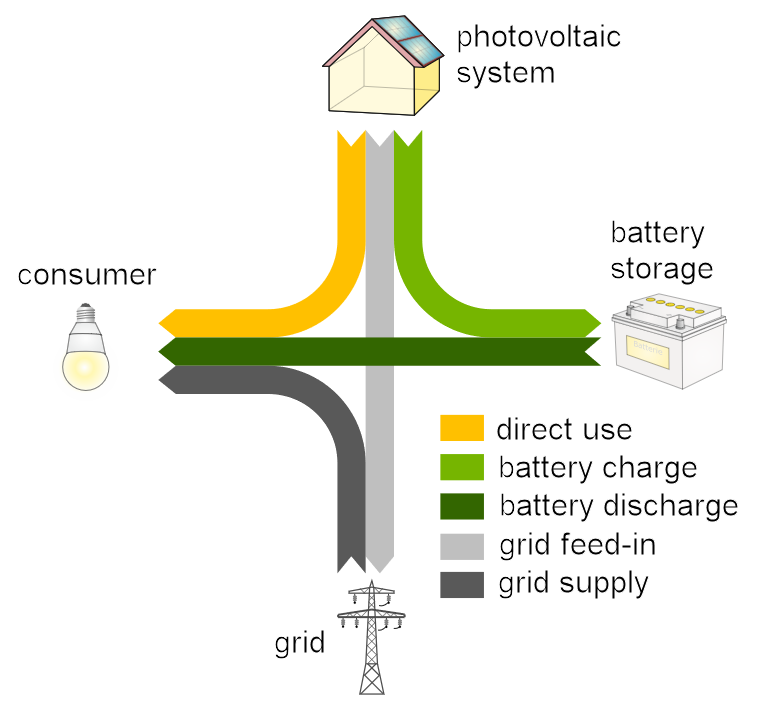
In the diagram you can also see how much electricity is fed into the grid, taken from the grid, consumed directly or the amount that flows over the battery.

Annual Electricity Demand
Enter your annual electricity demand here. The average annual electricity demand of a single family house in Germany
is about 4000 kWh. The lower the annual electricity demand, the higher the achievable degree of self-sufficiency.
 to the top
Photovoltaic Power
Here you should define the size of the photovoltaic system (nominal power of the photovoltaic modules). For 1 kWp photovoltaic power you need a roof area of about 5 to 10 m². The higher the photovoltaic power, the higher the achievable degree of self-sufficiency.
to the top
Useable Battery Capacity
The battery size is defined by the useable battery capacity. The useable capacity of a battery storage is usually lower than the nominal capacity and should be given in the data sheet of the battery manufacturer. The higher the battery capacity, the higher the self-consumption rate and the degree of self-sufficiency.
to the top
Self-consumption Rate
The self-consumption rate describes the share of the generated solar electricity that is either simultaneously consumed or used for battery charging. If the self-consumption rate rises the amount of solar electricity that is fed into the grid decreases.
to the top
Degree of Self-sufficiency
The degree of self-sufficiency describes the share of the electricity consumption that is covered by the photovoltaic storage system either by simultaneous consumption of the generated solar electricity or by discharge of the battery. If the degree of self-sufficiency increases the amount of electricity from the grid decreases.
to the top
Development of the Independence Calculator
The independence calculator was developed by the Solar Storage Systems research group of Prof. Volker Quaschning at the HTW Berlin. Special thanks go to Johannes Weniger, Tjarko Tjaden, Joseph Bergner und Martin Hofmann. Further background information on the calculations can be found here.
The related project was funded by the Environmental Relief Program (UEP II) that is co-financed by the European Union through the European Regional Development Fund (ERDF) and the state of Berlin.
The toolbox for the online graphics is from highcharts.com.