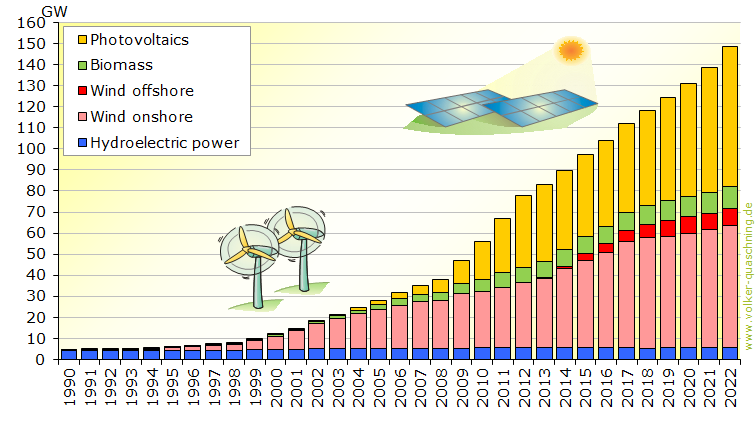
Renewable Electricity Generation Capacity in Germany
The installed capacity of renewable power plants has increased very fast during the last years in Germany. Since 2000 wind power has the highest installed power belong renewables. Photovoltaic power came on the first place in 2012 and 2013. In 2014 wind power got the leading position back due to bad supporting schemes for photovoltaic systems by the German government.
The installed power of biomass and hydro power systems is much lower. However, since these power plants usually reach much more full load hours the distance at the power generation is lower. The high installation figures for renewable power has also increased the total installed power capacity in Germany. About half of the installed power in Germany is already renewable. Nuclear power stations will decommission due to the nuclear phase out within the next years. Coal power plants will follow for climate protection. Hence, the renewable power share has already reached more than 50 percent.<

| Year | Hydro power 1 | Onshore wind | Offshore wind |
| 2019S | 8,5 | 49,2 | 0,04 |
| 2018 | 8,41 | 45,45 | 0,042 |
| 2017 | 7,99 | 42,49 | 0,038 |
| 2016 | 7,68 | 40,72 | 0,038 |
| 2015 | 7,47 | 39,22 | 0,034 |
| 2014 | 7,26 | 37,90 | 0,033 |
| 2013 | 7,04 | 36,71 | 0,03 |
| 2012 | 6,75 | 34,08 | 0,019 |
| 2011 | 6,42 | 25,92 | 0,008 |
| 2010 | 5,46 | 18,01 | 0,008 |
| 2009 | 4,87 | 10,57 | 0,008 |
| 2008 | 3,69 | 6,12 | 0,003 |
| 2007 | 3,39 | 4,17 | 0,003 |
| 2006 | 3,01 | 2,90 | 0,0002 |
| 2005 | 2,35 | 2,06 | 0,0002 |
| 2004 | 1,69 | 1,11 | 0,0002 |
| 2003 | 1,43 | 0,44 | 0 |
| 2002 | 1,03 | 0,32 | 0 |
| 2001 | 0,83 | 0,21 | 0 |
| 2000 | 0,70 | 0,09 | 0 |
| 1999 | 0,55 | 0,03 | 0 |
| 1998 | 0,46 | 0,022 | 0 |
| 1997 | 0,30 | 0,016 | 0 |
| 1996 | 0,26 | 0,010 | 0 |
| 1995 | 0,23 | 0,007 | 0 |
| 1994 | 0,21 | 0,006 | 0 |
| 1993 | 0,17 | 0,004 | 0 |
| 1992 | 0,14 | 0,003 | 0 |
| 1991 | 0,14 | 0,002 | 0 |
| 1990 | 0,13 | 0,002 | 0 |
| Year | Biomass 2 | Photovoltaics | Geothermal |
| 2019S | 8.5 | 49 | 0.04 |
| 2018 | 8.41 | 45.28 | 0.042 |
| 2017 | 7.99 | 42.34 | 0.038 |
| 2016 | 7.68 | 40.68 | 0.038 |
| 2015 | 7.47 | 39.22 | 0.034 |
| 2014 | 7.26 | 37.90 | 0.033 |
| 2013 | 7.04 | 36.71 | 0.03 |
| 2012 | 6.75 | 34.08 | 0.019 |
| 2011 | 7.26 | 25.43 | 0.01 |
| 2010 | 6.61 | 17.94 | 0.01 |
| 2009 | 6.00 | 10.57 | 0.01 |
| 2008 | 5.27 | 6.12 | 0.002 |
| 2007 | 4.72 | 4.17 | 0.002 |
| 2006 | 4.28 | 2.90 | 0.0002 |
| 2005 | 3.53 | 2.06 | 0.0002 |
| 2004 | 2.63 | 1.11 | 0.0002 |
| 2003 | 2.33 | 0.44 | 0 |
| 2002 | 1.62 | 0.30 | 0 |
| 2001 | 1.41 | 0.18 | 0 |
| 2000 | 1.29 | 0.11 | 0 |
| 1999 | 1.10 | 0.07 | 0 |
| 1998 | 1.00 | 0.054 | 0 |
| 1997 | 0.83 | 0.042 | 0 |
| 1996 | 0.81 | 0.028 | 0 |
| 1995 | 0.74 | 0.018 | 0 |
| 1994 | 0.71 | 0.012 | 0 |
| 1993 | 0.74 | 0.009 | 0 |
| 1992 | 0.69 | 0.006 | 0 |
| 1991 | 0.69 | 0.002 | 0 |
| 1990 | 0.68 | 0.002 | 0 |
| Year | Total renewable | Gross capacity | Renewables share |
| 2019 | |||
| 2018 | 118.3 | ||
| 2017 | 111.7 | ||
| 2016 | 103.4 | ||
| 2015 | 96.9 | ||
| 2014 | 93.1 | ||
| 2013 | 85.0 | 189.4 | 44.9% |
| 2012 | 77.6 | 184.7 | 42.0% |
| 2011 | 67.4 | 175.1 | 38.5% |
| 2010 | 57.1 | 170.8 | 33.5% |
| 2009 | 47.6 | 157.6 | 30.2% |
| 2008 | 40.4 | 151.3 | 26.7% |
| 2007 | 36.2 | 145.0 | 25.0% |
| 2006 | 32.9 | 140.2 | 23.5% |
| 2005 | 29.2 | 136.9 | 21.3% |
| 2004 | 25.5 | 134.5 | 19.0% |
| 2003 | 22.3 | 129.1 | 17.3% |
| 2002 | 18.8 | 127.2 | 14.8% |
| 2001 | 15.2 | 128.2 | 11.8% |
| 2000 | 12.3 | 125.5 | 9.8% |
| 1999 | 10.2 | 122.1 | 8.3% |
| 1998 | 8.3 | 121.0 | 6.9% |
| 1997 | 7.3 | 122.2 | 5.9% |
| 1996 | 6.7 | 123.1 | 5.4% |
| 1995 | 6.2 | 124.0 | 5.0% |
| 1994 | 5.5 | 122.4 | 4.5% |
| 1993 | 5.2 | 122.1 | 4.3% |
| 1992 | 4.9 | 123.2 | 4.0% |
| 1991 | 4.8 | 126.1 | 3.8% |
| 1990 | 4.7 | 125.9 | 3.7% |
sources: BMWi, AGEB, AGEEstat, IEA-PVPS
S prilimary data
1 Hydroelectricity: incl. pumped storage with natural influx
2 biomass incl. waste